by Lisa Cooke | Apr 21, 2016 | 01 What's New, Conferences
NGS 2016 live streaming options have expanded this year–and include FREE Genealogy Gems classes you can watch on your mobile device wherever you  are.
are.
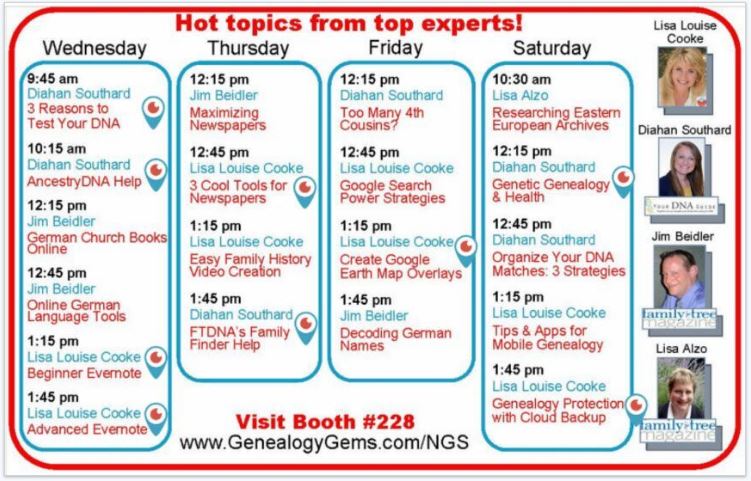
Can’t make it to NGS 2016? You’re not the only one! You can still join the fun, though–and for free. Lisa Louise Cooke will be live-streaming several lectures from the Genealogy Gems booth “theater” in the Exhibit Hall at NGS from May 4-7, 2016.
Streaming classes are scheduled as follows (so far–more may be added). The time zone for the conference is Eastern standard.
Wednesday, May 4:
9:45 am: Diahan Southard, 3 Reasons to Test Your DNA
10:15 am: Diahan Southard, AncestryDNA Help
1:15 pm: Lisa Louise Cooke, Beginner Evernote
1:45 pm: Lisa Louise Cooke, Advanced Evernote
Thursday, May 5:
12:45 pm: Lisa Louise Cooke, 3 Cool Tools for Newspapers
1:45 pm: Diahan Southard, FTDNA’s Family Finder Help
Friday, May 6:
1:15 pm: Lisa Louise Cooke, Create Google Earth Map Overlays
Saturday, May 7:
12:15 pm: Diahan Southard, Genetic buy medicine online philippines Genealogy & Health
1:45 pm: Lisa Louise Cooke: Genealogy Protection with Cloud Backup
How to watch the free NGS 2016 live streaming sessions from Genealogy Gems
Lisa will stream again through the free Periscope app, which she used for RootsTech 2016. Get the Periscope app in Apple’s App Store or Google Play,  sign up for a free account, and follow Lisa Louise Cooke to tune in. Sign up for notifications in Periscope, and your phone will “ping” when she starts streaming.
Click here for the full list of NGS 2016 free Genealogy Gems booth classes, being taught on-site by Lisa Louise Cooke and Diahan Southard from Genealogy Gems and their partners from Family Tree Magazine. More streaming sessions may be added. Be sure to like and follow the Genealogy Gems Facebook page for last-minute additions!
FREE: Watch Classes that Streamed Live from RootsTech 2016
How to Use Your Mobile Device for Genealogy
Powerful Google for Genealogy Search Strategies
by Lisa Cooke | Jun 11, 2015 | 01 What's New, African-American, Ancestry, Beginner, Census, FamilySearch, History, images, Records & databases, Research Skills, United States

Sample census detail image from Ancestry.com.
Imagine taking a standard U.S. census form, translating it into Spanish, administering it to a newly-American population whose racial identity is highly politicized, translating the results back into English and trying to make sense of them 100 years later.
That’s what happens when you’re looking at 1910 census in Puerto Rico.
I stumbled on this story when my dad, a FamilySearch indexer, called my attention to a current project to index previously-missed parts of the 1910 census. A lot of the missing data was for Puerto Rico. The forms are in Spanish. My dad asked my help translating some of what he was reading, since I speak some Spanish. He was concerned that the computer was interpreting some of the abbreviations in English when they were likely Spanish abbreviations. I looked into it and what I found reminded me of these lessons:

From “The US Census and the Contested Rules of Racial Classification in Early Twentieth-Century Puerto Rico,” by Mara Loveman, in Caribbean Studies, 35:2 (July-Dec 2007), 3-36. Click image to go to the paper.
Always read the record itself and seek to understand it. Don’t just rely on the index! The published images of this census on Ancestry interpret “B” in the race column as “Black,” but a little research (thank you, Google Scholar!) reveals that the census takers entered the race in Spanish–so “B” was for “blanco” (read about it in this academic paper).
When you see someone’s race change over the course of a lifetime, consider the historical context. Puerto Rican census data from the early 1900s “show a population becoming significantly whiter from one census to the next” because of “changes in how race was classified on census returns,” says the same paper. Not only were there changes in the official instructions, but the enumerators increasingly didn’t follow them. In fact, on several thousand census entries in 1910 and even more in 1920, “individuals’ racial classifications were manually crossed out, and a different ‘race’ was written in. These post-enumeration edits, it turns out, were done by a select group of Puerto Ricans hired to supervise and ‘correct’ the work of fellow Puerto Rican enumerators.”
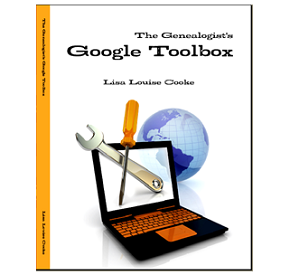
 This little historical trivia is not so trivial if you’re wondering why your ancestor may be identified by a different race than you expected. Learn more about finding academic papers like the one quoted here in The Genealogist’s Google Toolbox by Lisa Louise Cooke. Her book shows you how to search Google Scholar for gems like this that make your family history more clear!
by Lisa Cooke | Jun 5, 2015 | 01 What's New, Records & databases
Every Friday, we blog about new genealogy records online. Do the collections below include your ancestor? Don’t forget: tomorrow is Lisa Louise Cooke’s FREE live streaming class on using Google Tools to Solve Family Mysteries–use them to find more records like these! (Details below.)
This week: Irish newspapers, London electoral registers, Ohio naturalizations and Virginia vital records (through 2014!).
IRISH NEWSPAPERS. Subscribers at FindMyPast can now access over a million new Irish newspaper articles. These eight papers have updates: Cork Examiner, 1841-1896, Derry Journal, 1825-1950; Freeman’s Journal, 1820-1900; Roscommon Journal and Western Impartial Reporter, 1828-1864; Saunder’s News-Letter, 1773-1864; Ulster Gazette, 1844-1871; Waterford Chronicle, 1827-1870 and Waterford Mail, 1824-1870.
LONDON ELECTORAL RECORDS. Nearly 3 million indexed records have been added to the free England, London Electoral Registers, 1847–1913 database at FamilySearch.org. The overall collection contains more than 660,000 digital images of electoral registers filmed at the London Metropolitan Archives.
OHIO NATURALIZATIONS. Over 80,000 indexed names have been added to the US, Ohio, Southern District Naturalization Index, 1852–1991. This database covers a prime migration route: north of the Ohio River (records include courts at Cincinnati, Dayton, Columbus and Steubenville). The index points toward records that can traditionally be tough to find because people could naturalize at any court.
VIRGINIA VITAL RECORDS. Ancestry subscribers can now access these new databases: Virginia, Divorce Records, 1918-2014, Virginia, Death Records, 1912-2014, Virginia, Marriage Records, 1936-2014 and Virginia, Birth Records, 1864-2014. These records–available through 2014–come from the Virginia Department of Health.
 Here’s a tip: Harness Google’s power to search for specific record sets in which your family may appear. Watch Lisa’s free live streaming class TOMORROW, June 6, “Google Tools and Procedures for Solving Family History Mysteries.” Click here for details. Can’t watch tomorrow? You can still register to watch the class in the SCGJ archive through July 5.
by Lisa Cooke | May 22, 2015 | 01 What's New, Records & databases
Every Friday, we blog about new genealogy records online. Might these collections include your ancestors? This week: Civil War stereographs, Dublin workhouse registers, Illinois naturalizations, a Jersey digital archive and Oregon motor registrations and offenses. Don’t miss our Google tip at the end!
CIVIL WAR STEREOGRAPHS. “The Library of Congress has acquired 540 rare and historic Civil War stereographs from the Robin G. Stanford Collection,” says a press release. “The first 77 images are now online, including 12 stereographs of President Lincoln’s funeral procession through several cities and 65 images by Southern photographers showing South Carolina in 1860-61. The images can be viewed in this gallery within the Library’s Prints and Photographs Online Catalog. More images will be added each month, until all are online.”
DUBLIN WORKHOUSE REGISTERS. More than 1.5 million Dublin workhouse registers, 1840-1919 are now searchable for FindMyPast subscribers. Records include both images and transcripts, and may contain names, marital status, occupation, religion, age, birth year, admission year, name of workhouse and (on images) details about family, condition upon admitttance and date left workhouse or died.
ILLINOIS NATURALIZATIONS. Over a half million digitized images are searchable for free at US, Illinois, Northern District Petitions for Naturalization, 1906–1994 at FamilySearch.
JERSEY HERITAGE DIGITAL ARCHIVE. Over 300,000 items are now searchable at the subscription website Jersey Heritage Archives & Collections Online. Featured collections include registration cards of 30,000+ Channel Islanders who were there during the WWII German occupation. You’ll also find Jersey parish records dating to 1842 and (under Superintendent Registrar) parish registers from 1540-1842 and post-1842 civil marriage records.
OREGON MOTOR VEHICLE REGISTRATIONS AND CONVICTIONS for 1911-1946 are now searchable by Ancestry subscribers. Registrations include license number, name and address of the vehicle owner (including county in parentheses), make of car, motor number, model or year of manufacture and type of body. Records of convictions name the offender, date, offense, license number, court, county and the amount of any fines.

Tip of the week: Whenever you look at any record of an ancestor, ask what additional documents, images, video footage or historical material this record points you toward. For example, you might learn from an above record that Grandpa drove a 1935 Auburn Speedster or that a relative suffered from the German occupation on Jersey. Google searches on these niche topics can lead you to a Speedster photograph or historical materials (including footage) on the occupation, like this interview with a survivor of the German occupation. Learn how to search for gems like these in Lisa’s totally-revised, updated 2nd edition of The Genealogist’s Google Toolbox.
 are.
are.![]() sign up for a free account, and follow Lisa Louise Cooke to tune in. Sign up for notifications in Periscope, and your phone will “ping” when she starts streaming.
sign up for a free account, and follow Lisa Louise Cooke to tune in. Sign up for notifications in Periscope, and your phone will “ping” when she starts streaming.


