1950 US Census Maps – How to Find and Use Them
In Elevenses with Lisa episode 79 Lisa Louise Cooke explains:
- How to find 1950 US Census Enumeration District (ED) Maps
- The purpose behind them and how to interpret the maps
- Ways to use the maps for your genealogy
This is a follow up to episode 51 on The 1950 Census for Genealogy. In that episode I discussed the importance of finding your ancestors’ enumeration district numbers in order to be able to find them when the digitized images are released (before the index is available.) In this episode I will walk you through how to locate the enumeration district (ED) number and then find the actual 1950 US Census ED map. We’ll wrap things up with a quick update on the release of the 1950 US Federal Census.
Episode 79 Show Notes
(Get your ad-free Show Notes Cheat Sheet at the bottom of this page in the Resources section.)
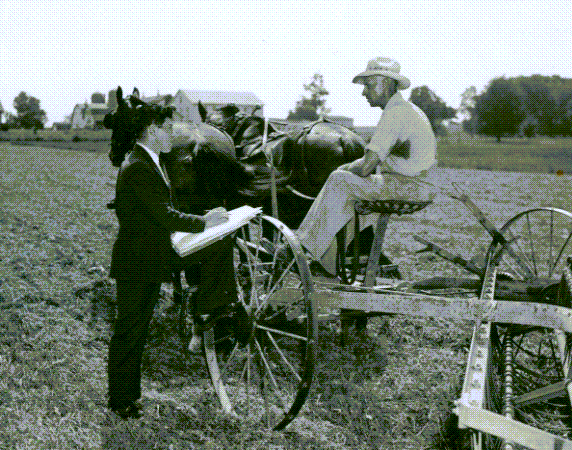
As I mentioned in Elevenses with Lisa episode 51 The 1950 Census for Genealogy, prior to 1880, U.S. Marshalls were the enumerators for the federal decennial census. Starting with the 1880 census enumerators were hired and they were each assigned an enumeration district, also known as an ED. These districts had to be mapped out so that the enumerators knew the area they were responsible for counting. Therefore, maps are drawn in anticipation of each census being taken, including the 1950 census.
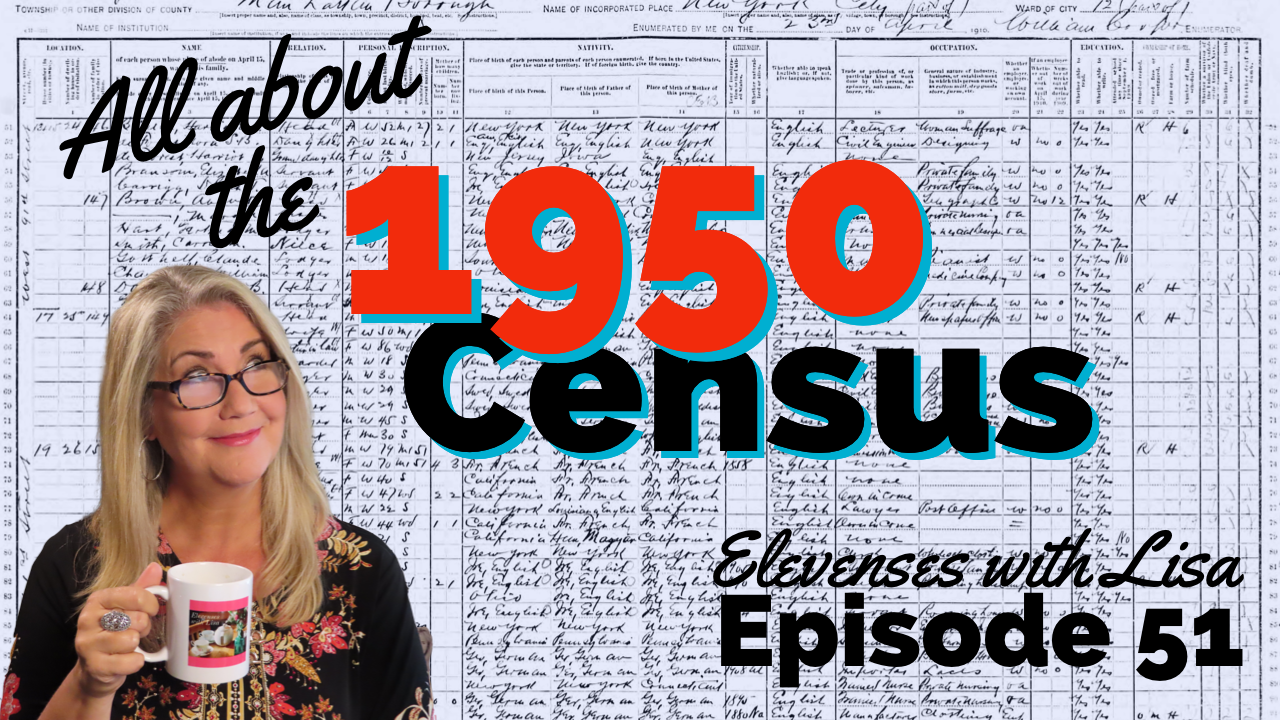
Learn more by watching episode 51 on the 1950 census.
About the 1950 US Census Maps
It’s always important to understand the purpose of a record or source, and the 1950 Enumeration District maps (ED maps) are no exception. Unlike most maps where it’s all about accurately drawing up the current roads and geographical features, census ED maps are drawn up for the purpose of defining boundaries for the purpose of counting people. This means as we look at ED maps we need to keep a few things in mind.
The first thing to understand is that the 1950 ED maps were not necessarily up-to-date with the lay of the land in 1950. Not all streets, parks and features will be included. The reason for this is that the maps themselves were not created for this purpose. Existing maps were used and then enumeration district boundaries were drawn on them.
Maps came from a variety of sources including but not limited to county and City Planning Commissions, 1940 census bureau tract maps, and city engineers. In fact, from a mapping perspective the variety of maps in the collection are fascinating.
Look for the map title, description, legend and census stamps typically found in one of the corners. In this example (see image) from Aurora, Colorado the map used was originally created by the city engineer in 1946 and was revised in 1947.
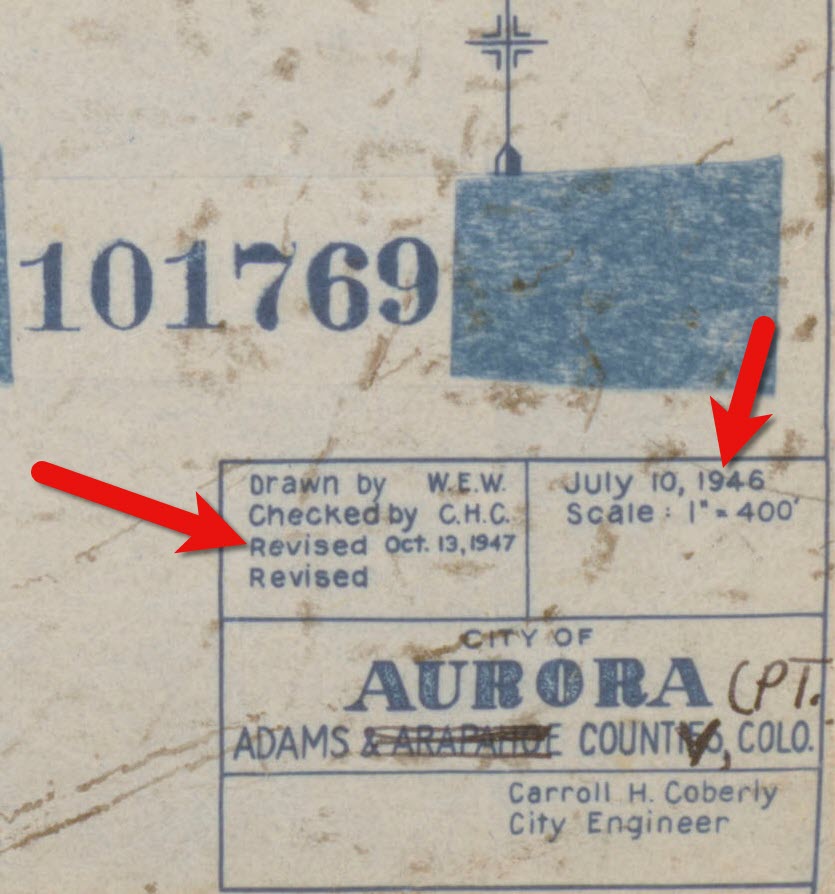
1950 census map of Aurora, Colorado (Source: National Archives)
Following the end of World War II, the United States was growing at a quick pace in 1950. This is particularly true of the newly emerging suburbs. Therefore, if your ancestors built a new home in a new development in 1949, don’t be surprised if you don’t see the street on the 1950 census ED map. However, rest assured that the maps still hold value for your family history as they provide many interesting and unique details about the area surrounding your ancestors’ homes.
Each map was stamped with a small legend where the meaning for each of the colored lines drawn could be indicated. From my random sampling of 1950 census maps across the United States it appears that the coloring coding was consistent as follows:
- Red = Township
- Green = Corporate Limits/Ward
- Orange = Enumeration District
Expect to see errors, inconsistencies and omissions in the maps. The more rural the area the more likely the map was compiled from several sources by the Census Bureau cartographers. This compilation created more opportunity for errors, and often used older maps.
Source: National Archives
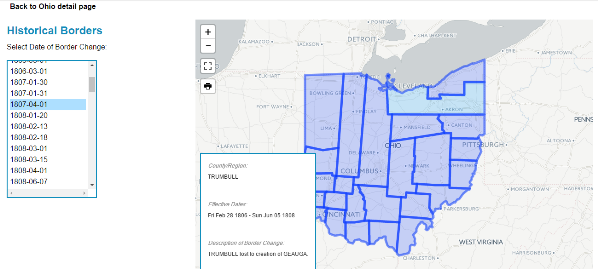
The Meaning of Census Enumeration District Numbers
A census enumeration district number is made up of two numbers separated by a dash. The first number (in this example: 1) represents the county/region. The second number represents the area within the county that could be covered by an individual census enumerator within the amount of time provided for taking the census, about 2-4 weeks. The official start of the 1950 US Federal Census was April 1, 1950.
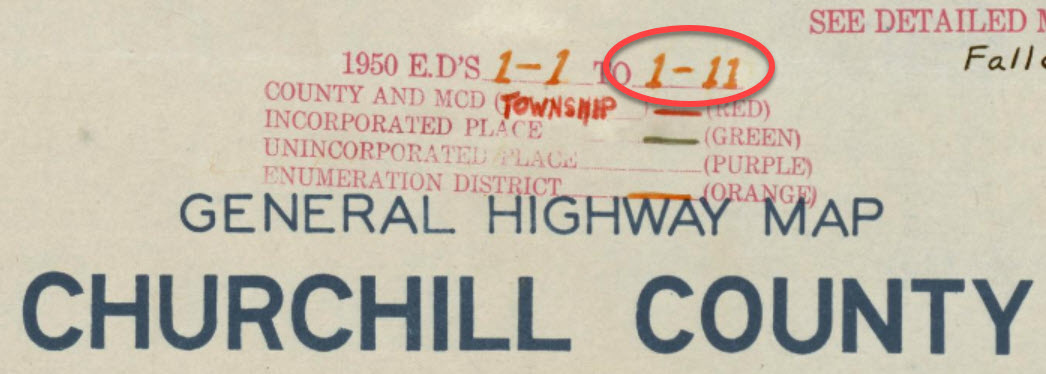
Census enumeration district (ED) numbers on a 1950 census map.
How to Find 1950 Census Maps
Some 8,000 census maps have been digitized and are available at the National Archives. However, the National Archives website can be challenging to navigate. I recommend using the Unified 1880-1950 Census ED Finder Tool at Steve Morse’s website.
1. Go to https:/stevemorse.org
2. In the menu in the upper left corner hover over US Census and in the secondary menu click Unified 1880-1950 Census ED Finder
3. Select the state from the first drop-down menu.
4. Next select the county.
5. Then select the city.
6. You will then see many enumeration district links listed. In order to find the right one for your ancestor’s home, enter the house number and select the street from the next drop-down menu. Don’t worry about directional parts of the address like west or east unless they are offered in the list of street names.
7. As soon as select the street name, the list of ED numbers should be reduced. In this example we are down to three.
8. To further reduce the possible ED numbers, we can select Cross or back street on same city block. If you’re not sure what the neighboring streets are, click the see Google Map This will plot the address you entered into Google Maps where you can then find the closest cross street, and the next streets over. If the address is not precisely marked on the map, check the address that appears in the Google Maps search box.
In my case, the One-Step tool didn’t allow me to specific W. Arcade, so Google Maps just gave me the general area, and not the address. By adding the W. to the address and pressing enter on my keyboard Google Maps was able to precisely plot the location. Now we can make note of the closest cross street (ex. N. Center), the street north of the address (E. Monterey Ave.) and the street south of the address (W. Noble St.)
9. Head back to the Unified 1880-1950 Census ED Finder page and enter each nearby street (you can enter multiple.) This should reduce the ED numbers one. This is the ED that includes your ancestor’s address.
How to Find 1950 Census Maps
1. Make note of the ED number, and then go back and click the button that says See ED Maps for ____________ County. You could have clicked this button without going through the process of locating the ED number, but the ED number makes it much easier to find your ancestor’s home street on the map. This number will also assist you in being able to find your ancestors in the 1950 census before it is indexed.
2. You will now be on the Viewing 1950 Enumeration District Maps in One Step Re-enter the city from the drop-down menu.
3. Click the Get ED Map Images You will receive two links. The first link is Links to NARA viewer will take you to the page on the National Archives website which includes all of the information about the map and the record hierarchy. Source citation information can be gathered from this page.
5. Click the second link called Direct links to jpegs on NARA server. This will take you to the image by itself as hosted on the National Archives website. I find this the easiest way to save the full resolution image to my computer hard drive. On my PC I right-click on the map and select Save Image As.
This page is also important if you want to use this image in another program such as Google Earth. The URL for this page is the direct URL to the image. Notice that it ends in .jpg. This means that it is the image alone, and this link can be used to create a custom map overlay in Google Earth. You can see an example of a custom map overlay in my video Create a Family History Tour with Google Earth Pro at the 06:13 mark.
Resources
- Download the ad-free show notes (Premium Member log in required. Not a Premium Member? Become a Genealogy Gems Premium Member.)
- Subscribe for free to our Genealogy Gems YouTube channel so you’ll never miss another episode.
- Subscribe to my free email newsletter to get notifications of new videos and articles.
 The
The